The
candlestick techniques we use today originated in the style of
technical charting used by the Japanese for over 100 years before the
West developed the bar and point-and-figure analysis systems. In the
1700s, a Japanese man named Homma, a trader in the futures market,
discovered that, although there was a link between price and the supply
and demand of rice, the markets were strongly influenced by the emotions
of traders. He understood that when emotions played into the equation, a
vast difference between the value and the price of rice occurred. This
difference between the value and the price is as applicable to stocks
today as it was to rice in Japan centuries ago. The principles
established by Homma are the basis for the candlestick chart analysis,
which is used to measure market emotions surrounding a stock.
Doji
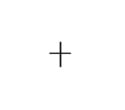 A single candlestick that indicates indecision -
(1) The opening price and the closing price are almost the same. This is depicted by the horizontal line.
(2) There is an upper tail/shadow and lower tail/shadow This is depicted by the vertical line.
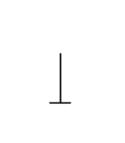
Bullish - Dragonfly Doji
A single candlestick - bullish doji
(1)
Price opens at the high of the session, has a large decline during the
session and then price closes at the high of the session.
(2) There is a long lower tail and no upper tail.
(3) Most meaningful when it is displayed in a downtrend where bearish candlesticks precede it.
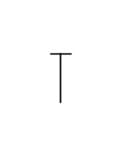
Bearish - Gravestone Doji
A single candlestick - bearish doji
(1) Price opens at the low of the session, has a large rally during the session and closes at the low of the session.
(2) There is a long upper tail and no lower tail.
(3) Most meaningful when it is displayed in an uptrend where bullish candlesticks precede it.
Spinning Top Doji
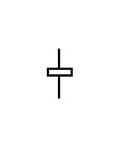
A single candlestick that indicates indecision -
(1) The closing price is slightly above the opening price. This is depicted by the white box.
(2) There is an upper tail and a lower tail.
(3) Most meaningful when it is displayed as part of a candlestick pattern.
Bullish Belt-hold
A single candlestick -
(1)
The opening price is at the low of the session. Price rallies during
the session and closes at or near session highs. This forms a white or
bullish candlestick.
(2) There is usually no lower tail and a small or no upper tail.
(3) The longer the candlestick the more powerful the signal.
(4) Best if this appears after a downtrend and then followed up with a bullish candlestick the next session.
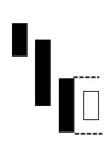
Bullish Engulf
A two candlestick pattern –
(1) Definable downtrend in progress.
(2) White or bullish candlestick must completely “cover” or engulf the body of the previous black candlestick.
(3)
The body of the engulfing candlestick must be the opposite color of the
preceding candlestick (the exception is if the previous candlestick is a
doji (a doji looks like a small letter “t” or plus sign”+”) or small
bodied candlestick).
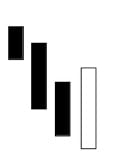
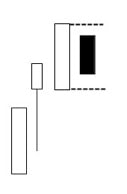
Bullish Harami
A two candlestick pattern –
(1) Definable downtrend in progress.
(2) White or bullish candlestick closes within the body of the previous black candlestick.
(3) Confirmation is required.
Bullish Kicker
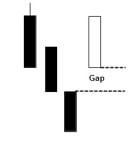
A two candlestick formation –
(1) First candlestick is black or bearish.
(2) Second candlestick opens above the close of the first candlestick forming a gap.
(3)
Price during the formation of the second candlestick never drops into
the gap. Thus, there is usually no bottom wick on the second
candlestick.
This
pattern need not occur after a lengthy downtrend. It simply indicates
an abrupt change in sentiment most likely due to a news event.
Bullish - Morning Star
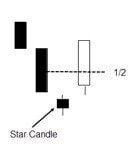
A three candlestick pattern –
(1) Definable downtrend in progress.
(2) First candlestick has a long black body indicating that the downtrend is still in progress.
(3)
Second candlestick gaps away from the first candlestick and opens and
closes at or near the same level. This indicates indecision.
(4)
Third candlestick is a long white or bullish candlestick that gaps up
from the second candlestick. This third candlestick closes at least
halfway above the body of the first candlestick.
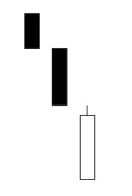
Bullish - Piercing candlestick
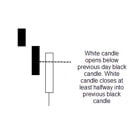
A two candlestick pattern-
(1) Definable downtrend in progress
(2) First candlestick is black or bearish candlestick
(3)
Second candlestick is white or bullish. This candlestick below the
previous day’s black candlestick and closes above the midpoint of the
previous day’s white candlestick.
Bullish - Hammer
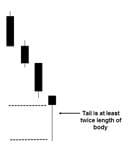
A single candlestick signal that needs bullish followup –
(1) Definable downtrend in progress.
(2) Tail of candlestick is at least twice the length of the body of this candlestick.
(3)
the candlestick following the hammer candlestick needs to be bullish or
white or price needs to be closing at higher levels above the hammer
candlestick to indicate buying activity.
Bearish Belt-hold
A single candlestick -
(1)
The opening price is at the high of the session. Price declines during
the session and closes at or near session lows. This forms a black or
bearish candlestick.
(2) There is usually no upper tail and a small or no lower tail.
(3) The longer the candlestick the more powerful the signal.
(4) Best if this appears after an uptrend and then followed up with a bearish candlestick the next session.
Bearish Engulf
A two candlestick pattern –
(1) Definable uptrend in progress
(2) First candlestick is a white or bullish candlestick.
(3) Second candlestick is black or bearish and must completely “cover” or engulf the body of the first white candlestick.
(4)
The body of the engulfing candlestick must be the opposite color of the
preceding candlestick (the exception is if the previous candlestick is a
doji (looks like a small letter “t” or plus sign “+” or small bodied
candlestick).
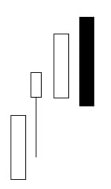
Bearish Dark Cloud Cover
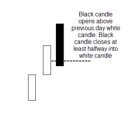
A two candlestick pattern-
(1) Definable uptrend in progress
(2) First candlestick is white or bullish candlestick
(3)
Second candlestick is black or bearish. This candlestick opens above
the previous day’s white candlestick and closes below the midpoint of
the previous day’s white candlestick.
Bearish Harami
A two candlestick pattern –
(1) Definable uptrend in progress
(2) First candlestick is a white or bullish candlestick.
(3) Second candlestick is black and closes within the body of the previous white candlestick
Bearish Kicker
A two candlestick formation –
(1) First candlestick is white or bullish.
(2) Second candlestick opens below the close of the first candlestick forming a gap.
(3)
Price during the formation of the second candlestick never rises into
the gap. Thus, there is usually no top wick on the second candlestick.
This
pattern need not occur after a lengthy uptrend. It simply indicates an
abrupt change in sentiment most likely due to a news event.
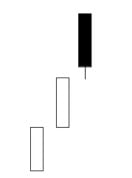
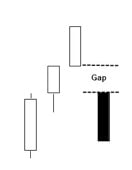
Bearish Evening Star
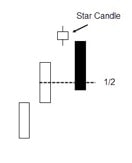
A three candlestick pattern –
(1) Definable uptrend in progress.
(2) First candlestick has a long white body indicating that the downtrend is still in progress.
(3)
Second candlestick gaps away from the first candlestick and opens and
closes at or near the same level. This indicates indecision.
(4)
Third candlestick is a long black or bearish candlestick that gaps down
from the second candlestick. This third candlestick closes at least
halfway below the body of the first candlestick.
Bearish Hangman
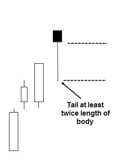
A single candlestick signal that needs bearish followup –
(1) Definable uptrend in progress.
(2) Tail of candlestick is at least twice the length of the body of this candlestick.
(3) Open and close are near the same level indicating indecision.
(4)
The candlestick following the hangman candlestick needs to be bearish
or black or price needs to be closing at lower levels below the hangman
candlestick to indicate selling activity.
Bearish Shooting Star
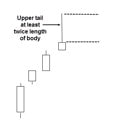
A single candlestick signal that needs bearish followup –
(1) Definable uptrend in progress
(2) The tail is above the body of the candlestick and the tail is at least twice the length of the body of the candlestick.
(3) Open and close are near the same level indicating indecision.
(4)
The candlestick following the shooting star candlestick needs to be
bearish or black or price needs to be closing at lower levels below the
shooting star candlestick to indicate selling activity.
Sources:
Japanese Candlesticks Definition
Introduction to Candlesticks - Stockcharts.com
Introduction to Candlesticks - PDF
Sources:
Japanese Candlesticks Definition
Introduction to Candlesticks - Stockcharts.com
Introduction to Candlesticks - PDF