Technical Analysis would be the part in the stock market that could be challenging to anyone. I started learning from reading materials and watching videos available online hence my studies was messed up as I am not sure where to start. Unknowingly, my determination to learn this aspect is paying off as I am able to interconnect the dots I have learned about stock market.
Here we go, my understanding about Technical Analysis in Stock Market.
Do you know the future of stock market? Of course no! There is no one that could 100% surely tell what will happen tomorrow. Only God knows the future.
So technical analysis is created to try predict the future price movement of stocks. So if someone will tell you that they can surely make you money in stock market then better get away from that person. He is trying to get your money and trying to scam you. No one knows the future! Do you?
Technical Analysis Summary of Basic Techniques:
1. Candlesticks
- Candlesticks analysis is basically a price action analysis. It is about analyzing how the stocks moves base your criteria which maybe by minutes, daily, weekly or monthly. It is analyze in here what was the opening price, close price, highest price and lowest price. If closing price is higher than the opening price then the candle is green and if closing price is lower than the opening price then the candle is red. Now interconnecting these candlesticks or price action movement then we can further our analysis about the price movement.
- Check this link about detailed discussion on Candlesticks : Click Here

- As the title says, you are just determining where is the price action movement is going. Is it going up, going down and moving sideways? Just put a line connecting higher lows for uptrend, lower highs for downtrend and range prices for sideways.

- Check this link about detailed discussion on trend lines : Click Here
- Support is where a declining trend can be expected to halt temporarily due to a concentration of demand.
- Resistance is where an advancing trend can be expected to halt temporarily due to a concentration of supply.
- Hence, this gives you an idea when to buy and when to sell.
- Hence, this gives you an idea when to buy and when to sell.
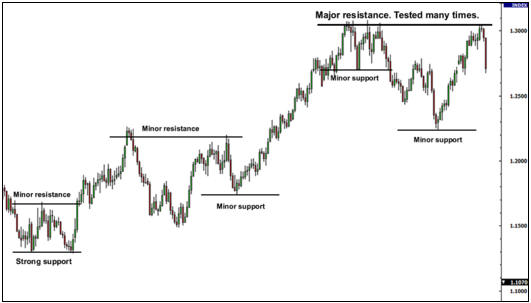
- Check this link about detailed discussion on support and resistance : Click Here
4. Elliot Wave Theory
- This is a technical analysis which tries to analyze financial market cycles and wherein Mr. Elliot proposed that market prices unfold in specific price pattern which we currently call as Elliot Waves. The basic way to analyze Elliot wave is to check the monthly, then the weekly, and then the daily trend. You are trying to see what waves do you belongs hence the you would ride the appropriate wave. You would not want to buy at the end of the wave for the up trend and of course you want to buy at the end of the wave for the down trend.
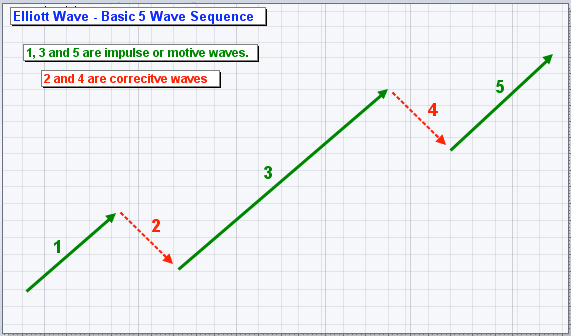
- Check this link about detailed discussion on Elliot Wave : Click Here
5. MACD
- It is basically a convergence of two moving averages wherein the crossover can be the signal for buy and sell.
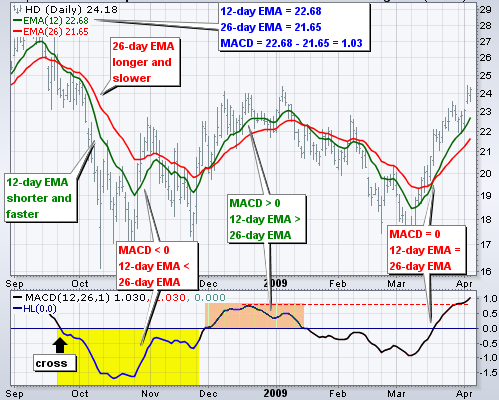
- Check this link about detailed discussion on MACD : Click Here
- Fibonacci is more of price retracement calculation. It is computing the probable areas of support and or resistance base from through to peak areas of prices. This serves as alert areas for possible reversal levels.
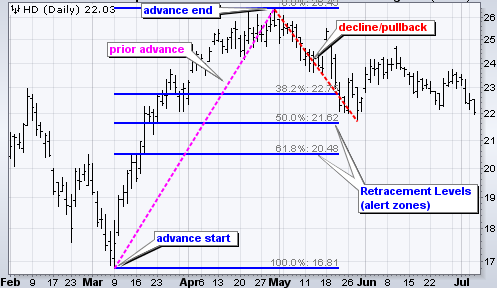
- Check this link about detailed discussion on Fibonacci : Click Here
7. Moving Averages
- As the title says, it is the moving averages of prices. So if it says, MA9 then it is the moving averages of prices of 9 days period. It is important to know the averages of prices so you will know where you are right now. Are you above the moving averages, below the moving averages and or your are exactly at the moving averages? Where it is headed? And usually, the shorter time frame moving averages determines where the prices is moving ahead.
- I just found out recently that there are a lot of usages of moving averages such as helpful in determining the price trend, as support and resistance, as sell and buy signal and etc. Lately, SWAG and AOTS are becoming popular in Facebook groups.
- Check this link about detailed discussion on Moving Averages : Click Here
8. Bollinger Bands
- This is technical analysis which measure price volatility (deviation).
- Check this link about detailed discussion on Bollinger Bands : Click Here
9. Stochastics Oscillator
- Stochastics Oscillator is a momentum indicator that shows the location of the close relative to the high-low range over a set number of periods. It follows the speed or the momentum of price.
- Check this link about detailed discussion on Stochastics Oscillator : Click Here
10. Money Flow Index
- Money Flow Index is also an oscillator but the difference is that it uses both price and volume to measure buying and selling pressure.
- Check this link about detailed discussion on Money Flow Index : Click Here
11. Volume
- This is a technical analysis support to determine where are the majority of prices. This also assist in determining volume of buyers and sellers. If there is a high volume and the trend is going down then better get out quickly also. But if there is a high volume and the trend is going up then hold position as the volume confirms the up trend.
I usually see comment in FB stock groups that even when the price goes up but without the support of volume then that price action is weak and or invalid. Someone is trying to manipulate the price movement.

12. Ichimoku Cloud
- This is a trading system using a set of indicators designed as a stand alone trading system. These indicators can be used to identify support and resistance, determine trend direction and generate trading signals.
- I actually find Ichimoku Cloud a bit complicated so I use only the simplest form I can get from this trading system. When the cloud is red and trending downward then it is down trend and if the cloud is green and trending upward then it is an up trend. The crossover or the change of cloud color is a buy or sell signal to me.
- I find Ichimoku Cloud unrealiable on range trading.
- Check this link about detailed discussion on Ichimoku Cloud : Click Here
13. News/Sentiment Analysis
- News or disclosures is one important aspect also in technical analysis because this cause the price movement. You should be updated regularly and knows when the news are expected to be disclosed to the public. Check this PSE Website : http://edge.pse.com.ph/
Please take note that all the above technical analysis techniques are easy to use as usually incorporated on your broker's online account. You do not have to compute anything. If not available on your broker then there are a lot of free charting that can be found online.
See my favorite links : Click Here.
Your role is only to know how to use them!
Good Luck!